What is Google Trends?
Google has become an important part of everyone’s lives. It is the world’s leading and most popular search engine due to its speed and the humongous amount of sites it have in its index which helps it to provide vast information on any topic. Google’s algorithm is much more sophisticated and this helps it to provide the most relevant information about the searched query. Due to all these factors Google is the most used search engine in the world with over 1.5 million users. In fact, Google processes an average of 40,000 search queries per second. Google also provides for various tools for the convenience of its users like Google Analytics, Google AdSense, Google Alerts, Gmail, Google Docs and many more. Google Trends is one such tool.
Google Trends is a website developed and launched by Google which tells you about the volume of searches for a particular term as compared to the total volume of searches over Google search engine. This website is developed to analyze the popularity of search query. It also allows you to analyze the change in search volume of a query over a geographical area like data regarding searches in US or in India or worldwide, time period like data over last year or last month and so on, category or industry like entertainment, sports, etc. and type of search like web search, news, shopping, YouTube, etc. This provides more finely grained data on the volume of search over a query. The site is easily accessible and provides with reliable and real time data. The data can be used to understand the ongoing market conditions and predict the possible future. It can be used by marketers and researchers to find out what is trending and make their strategies accordingly.
How to use Google Trends?
Google trends is very untroublesome and convenient. One can learn to operate it within seconds as it is very easy to understand. Anyone who has a Google account can access this tool for free. There are two front ends for Google Trends data, but the most useful for our purposes is http://www.google.com/insights/search which allows the user to download the query index data as a CSV file.
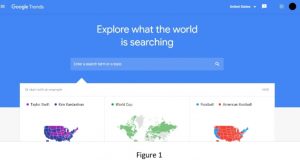
The site opens with a Home Page (Figure 1). There is a search bar on the Home Page which allows you to search the query about which you want the search volume data. The Home Page also provides for latest stories and widely discussed events so that the user can go through them. As the user scrolls down the Home Page he can also find queries that are trending i.e. the most searched queries in the recent times.
Figure 1
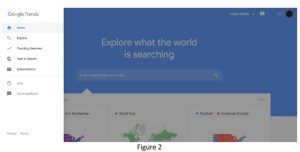
There is a drop down menu on the top left corner of the Home Page. On clicking on it there will be a list of options namely, Home, Explore, Trending Searches, Year in Search, Subscriptions, Help and Send Feedback (Figure 2). The user can visit any of these pages in accordance with his needs.
Figure 2
The user can search about any query and can also access data for the trending searches. On searching the query the website provides the data regarding the total query volume for search term in a given geographic region divided by the total number of queries in that region at a point in time. The query share numbers are then normalized so that they start at 0 in January 1, 2020. Numbers at later dates indicated the percentage deviation from the query share on January 1, 2020 . The data is represented in the form of a line graph. The user can refine the data on the basis of geographical location, time period, category or industry and the type of search. A sample of the search of a query is shown in Figure 3.
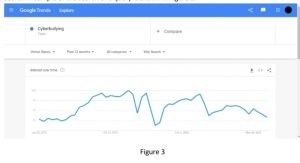
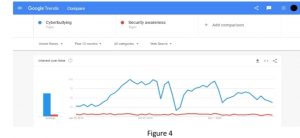
The user can also compare the volume search of a query with the volume search of other query by adding a query for comparison in “+ Compare” box that is adjacent to the main query topic (Figure 3). A sample of comparison between two queries is shown in Figure 4. The user can add multiple queries for comparison.
The user can check the trending searches by visiting the Trending Searches page via the drop down menu. The site also provides for category vise trending searches for previous years. The user can have access to it by visiting “Year in Search” page via the drop down menu.
Interpreting Google Trends
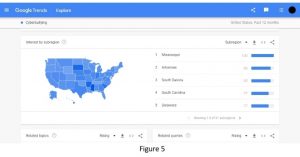
While interpreting the Google Trends Graphs one must understand what it depicts. The graphs don’t show the actual search volume numbers, but rather an index ranging from 0-100 with zero being not searched and 100 being the peak popularity of the term. Value of 50 means that the term is midway popular. The points refer to the search interest regarding that query with respect to the highest point on the chart for the selected region and time. Google Trends also provides for region wise search volume of a query of a particular country. The user can find out the popularity point of the query in a particular region by just placing the cursor on that particular region. The regions are also marked with different colors to represent different levels of popularity of the term (Figure 5).
Uses of Google Trends
Google Trends can be used by the researchers and the marketers to understand the ongoing trend in the market or in any area and it can also help them to analyze public behavior on various events. Various economist has shown how can Google Trends be used to do some basic research of market and can also be used for forecasting. Google Trends can be useful in the following ways:
1. Marketing Strategies: The marketers can use Google Trends to find out what is currently trending within their target audiences and can thus design marketing strategies and advertisements accordingly. This can help them keep their marketing strategies up to date and more attractive thus attracting more customers for the company. It can also be used to monitor the marketing performance of a company. Google Trends can also help the marketers to relocate its product in the areas where the people are more interested in it.
2. Research: Google Trends could also be used for research activities as a change in the volume of searches for a particular query is generally marked by a certain event. Thus the researcher by understanding the changes in the interest of the public on a certain topic can analyze the impact of the event on the public. For instance, in the recent times there has been a hike in the volume of searches for the term “racism” ( as shown in Figure 6).
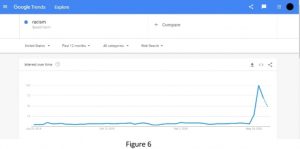
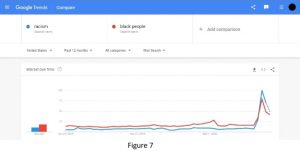
This hike in the interest of people is due to the ongoing worldwide protests against racism which sparked due to the murder of an US citizen George Floyed by a police officer just because he was black. Also when we compare the data for the terms “racism” and “black people” we see that the curves for the two terms is more or less similar in recent times ( Figure 7). Thus this reflects that the hike in the interest in racism is due to the racial discrimination faced by black people in US.
3. Writers and Bloggers: Writers and Bloggers too can use Google Trends to write on topics that are currently trending and that will grab the attention of the readers most in the current times.
Figure 7
4. Checking competitor’s performance: Google Trends can also help in analyzing the public’s response to the competitor’s products.
5. SEO and Content Marketing: One can use Google Trends to find out the words that are most searched and can add them in their blogs, papers etc. This would help driving traffic to one’s site.
Limitations of Google Trends
Even though Google Trends is an efficient tool there are some limitations in using Google Trends due to which it is not widely used as a tool for research, the most important of which are:
1. It allows only an aggregate look into the behavioral data and don’t provide actual figures. Thus a lot of work has to be done by social science researchers and policy-makers before the data can be used by them for their research work.
2. It takes into account only the “number of searched for a query” and not the “number of people searching the queries”. It might be possible that a major portion of queries comes only through a minor portion of population.
3. The geographic distribution of data has limited usefulness as IP addresses can’t always be properly allocated.
4. It is representative only where internet penetration is sufficiently high, thus neglecting the interests of people living in area with no internet access.
5. It comes with insufficiently described methodology.
6. Availability of the data is dependent on discretion of Google whose commitment to provide data may change over time.
7. Social Scientists are trained in traditional statistical methods and thus are reluctant to adopt Google Trends as a tool for social science research. It is although used as a source of experimental data for investigating possibilities.
8. Although the data is geo-tagged, IP-based geo-location is accurate only at country level .
Conclusion
Google Trends is a great powerful that can be used for research, marketing, forecast etc. There is plenty you can do with the help of Google Trends. It is tool provided by Google for free for the convenience of its users. The data provided by the site is reliable and it presents real time data so one doesn’t have to worry about whether the data is recent enough or not. Also the site is very convenient and anyone can use it as it doesn’t require much technical knowledge. However there are some limitations associated with the use of Google Trends like it provides aggregate data only, data is available for places where internet penetration is high, etc.
By: Arpita Goyal


Great Article